

Capacity Planning for
Microsoft SharePoint 2010
My Sites and Social Computing features
This document is provided “as-is”. Information and views expressed in this document, including URL and other Internet Web site references, may change without notice. You bear the risk of using it.
Some examples depicted herein are provided for illustration only and are fictitious. No real association or connection is intended or should be inferred.
This document does not provide you with any legal rights to any intellectual property in any Microsoft product. You may copy and use this document for your internal, reference purposes.
© 2010 Microsoft Corporation. All rights reserved.
Capacity Planning for
Microsoft SharePoint 2010
My Sites and Social Computing features
Gaurav Doshi, Wenyu Cai
Microsoft Corporation
Applies to: Microsoft SharePoint Server 2010
Summary: This whitepaper provides guidance on performance and capacity planning for a My Sites and Social computing portal based on Microsoft® SharePoint® 2010. This documents covers:
- Test environment specifications, such as hardware, farm topology and configuration
- Test farm dataset
- Test data and recommendations for how to determine the hardware, topology, and configuration that you need to deploy a similar environment, and how to optimize your environment for appropriate capacity and performance characteristics.
Table of Contents
Executive Summary…………………………………………………………………………………………………………………………….4
Introduction5
Scenario5
Assumptions and prerequisites5
Glossary5
Overview7
Scaling approach7
Correlating lab environment with production environment7
Test notes8
Test setup…………………………………………………………………………………………………………………………………………..9
Hardware9
Software9
Topology and configuration10
Dataset and disk geometry11
Transactional Mix12
Results and analysis15
Comparison of all iterations15
Impact of people search crawl19
Analysis20
Recommendations23
Appendix24
Executive summary
Overall, here are the key findings from our testing for the My Sites and Social Computing Portal:
- The environment scaled up to eight front-end Web servers for one application server and one database server; increase in throughput was almost linear throughout. After eight front-end Web servers, there are no additional gains to be made in throughput by adding more front-end Web servers because the bottleneck at this point was the database server CPU utilization.
- Further scale can be achieved by separating the Content database and Services database on two separate database servers.
- We maxed out the 8x1x2 topology. At that point both front-end Web server and application server CPU utilization was the bottleneck. That leads us to believe that for the given hardware, dataset, and test workload, the maximum RPS possible is represented by Max Zone RPS for 8x1x2, which is about 1877.
- Looking at the trends, it seems possible to extract the same throughput with a healthy farm, if the bottlenecks on the front-end Web server and application server are addressed. The front-end Web server bottleneck can be addressed by adding more front-end Web servers, and the application server bottleneck can be addressed by using two computers to play the role of application server. We did not try it out in the lab though.
- Latency is not affected by throughput or hardware variations.
- If you have security trimming turned ON, one front-end Web server can support about 8-10 RPS of Outlook Social Connector traffic. This means, one front-end Web server can support about 28,000 to 36,000 employees using Outlook Social Connector all day. Thus, if you are rolling out Outlook Social Connector to 100,000 employees, you can support the traffic that is generated by three front-end Web servers. These values can vary depending on social tagging usage at your company. If you imagine your company to have less social tagging activity than what we used in the dataset for this testing effort, you might get better throughput per front-end Web server.
- The incremental people search crawl doesn’t have much effect on the farm’s throughput as long as the farm is maintained in a healthy state.
Introduction
Scenario
This document outlines the test methodology and results to provide guidance for the capacity planning of a social computing portal. A social computing portal is a Microsoft® SharePoint® 2010 deployment where each person in the company maintains a user profile, finds experts in the company, connects with other employees through newsfeeds and maintains a personal site for document storage and sharing. In addition to this traffic caused by social computing features, there is good amount of typical collaboration traffic caused by people uploading, sharing, viewing, and updating documents on their personal sites. We expect these results to help in designing a separate portal dedicated to My Sites and social features.
Different scenarios will have different requirements, so it is important to supplement this guidance with additional testing on your own hardware and in your own environment.
When you read this document, you will understand how to:
- Estimate the hardware required to support the scale you need to support: number of users, load, and the features enabled.
- Design your physical and logical topology for optimum reliability and efficiency. High Availability/Disaster Recovery are not covered in this document.
- Account for effect of ongoing people search crawl and profile sync on the RPS of a social computing portal-like deployment
Before you read this document, you should read the following:
- Capacity Planning and Sizing for Microsoft SharePoint 2010 Products and Technologies
- Office SharePoint Server 2010 Software Boundaries
- SharePoint Server 2010 Technical Case Study: Social Environment, available for download on TechNet
If you are interested in reading capacity planning guidance on typical collaboration scenarios, please read: SharePoint Server 2010 Capacity Lab Study: Enterprise Intranet Collaboration Solution
Assumptions and prerequisites
- There is no custom code running on the social computing portal deployment in this case. We cannot guarantee the behavior of custom code or third party solutions that are installed on top of your My Site and social computing portal.
- Authentication mode was NTLM
Glossary
There are some specialized terms you will encounter in this document. Here are a few key terms and their definitions.
- RPS: Requests per second. The number of requests received by a farm or server in one second. This is a common measurement of server and farm load.
Note that requests are different from page loads; each page contains several components, each of which creates one or more requests when the page is loaded. Therefore, one page load creates several requests. Typically, authentication checks and events that are consuming negligible resources are not counted in RPS measurements. -
Green Zone: This is the state at which the server can maintain the following set of criteria:
- The server-side latency for at least 75 percent of the requests is less than 0.5 second.
- All servers have a CPU utilization of less than 50 percent.
Note: Because this lab environment did not have an active search crawl running, the database server was kept at 40 percent CPU utilization or lower, to reserve 10 percent for the search crawl load. This assumes Microsoft SQL Server® Resource Governor is used in production to limit Search crawl load to 10 percent CPU. - Failure rate is less than 0.01 percent.
-
Max Zone: This is the state at which the server can maintain the following set of criteria:
- HTTP request throttling feature is enabled, but no 503 errors (Server Busy) are returned.
- Failure rate is less than 0. 1 percent.
- The server-side latency is less than 1 second for at least 75 percent of the requests.
- Database server CPU utilization is less than 80 percent, which allows for 10 percent to be reserved for the Search crawl load, limited by using SQL Server Resource Governor.
- AxBxC (Graph notation): This is the number of Web servers, application servers, and database servers in a farm. So for example, 8x1x2 means that this environment has eight Web servers, one application server, and two database servers.
- VSTS Load: Threads used internally by Visual Studio Team System (VSTS) to simulate virtual users. We used increasing VSTS Load to generate more and more RPS for the topology.
Overview
Scaling approach
This section describes the specific order that we recommend for scaling computers in your environment, and it is the same approach we took for scaling this lab environment. This approach will allow you to find the best configuration for your workload and can be described as follows:
- First, we scaled out the Web servers. These were scaled out as far as possible under the tested workload, until the database server became the bottleneck and was not able to accommodate any more requests from the Web servers.
- Until this point, content database and services databases (user profile database, Social database, etc.) were all on the same database server. When we noticed that the database server was the bottleneck, we scaled out the database server by moving the content databases to another database server. At this point, the Web servers were not creating sufficient load on the database servers, so they were scaled out further.
- In lab environment, we did not test scale out further. But, if you need more scale, then the next logical step will be to have two computers share application server responsibilities.
We started off with a minimal farm configuration of one front-end Web server, one application server, and one SQL Server-based computer. Through multiple iterations, we finally ended at eight front-end servers, one application server, two SQL Server farm configurations. In the “Results and Analysis” section, you will find a comparison of Green Zone and Max Zone performance characteristics across different iterations. Details of how we found out Green Zone and Max Zone for each iteration is covered in “Appendix”.
Correlating lab environment with a production environment
The lab environment outlined in this document is a smaller scale model of a production environment at Microsoft, and although there are significant differences between the two environments, it can be useful to look at them side by side because they are both My Site and social computing environments where the patterns observed should be similar.
The lab environment contains a dataset that closely mimics the dataset from the production environment. The workload that is used for testing is largely similar to the workload seen in the production environment with few notable differences.
The most notable of the differences is that in the lab environment. We use fewer distinct users to perform the operations, and we perform operations on a smaller number of user profiles compared to the production environment. Also, the lab test runs happen over a shorter period of time.
All this has an effect on how many cache hits we have for the User Profile cache that is maintained on the application server. User Profile Service caches recently used user profiles on the application server. The default size of this cache is 256 MB, which approximately translates into 500,000 user profiles. Because the number of user profiles that was used in testing was limited to 1,500, and the duration of the tests were less than the recycle time of the cache, we almost always had cache hits. Thus, the throughput numbers presented in this document are on the higher side. You should definitely account for cache misses in your environment and hence, expect a lower throughput number.
For a detailed case study of a production My Sites and social computing portal at Microsoft, see SharePoint 2010 Technical Case Study: Social Environment.
Test notes
This document provides results from a test lab environment. Because this was a lab environment and not a production environment, we were able to control certain factors to show specific aspects of performance for this workload. In addition, certain elements of the production environment, in the following list, were left out of the lab environment to simplify testing overhead. Note that we do not recommend omitting these elements for production environments.
- Between test runs, we modified only one variable at a time, to make it easy to compare results between test runs.
- The database servers used in this lab environment were not part of a cluster because redundancy was not necessary for the purposes of these tests.
Search crawl was not running during the tests, whereas it might be running in a production environment. To take this into account, we lowered the SQL Server CPU utilization in our definition of Green Zone and Max to accommodate the resources that a search crawl would have consumed if it had been running simultaneously with our tests.
Test setup
Hardware
The following table presents hardware specifications for the computers that were used in this testing. Every front-end Web server (WFE) that was added to the server farm during multiple iterations of the test complies to the same specifications.
Front-end Web server |
Application server |
Database server |
|
|
Server model |
PE 2950 |
PE 2950 |
Dell PE 6850 |
|
Processor(s ) |
2px4c@2.33 GHz |
2px4c@2.33 GHz |
4px4c@ 3.19 GHz |
|
RAM |
8 GB |
8 GB |
32 GB |
|
Number of NICs |
2 |
2 |
1 |
|
NIC speed |
1 Gigabit |
1 Gigabit |
1 Gigabit |
|
Load balancer type |
F5 – Hardware load balancer |
n/a |
n/a |
|
ULS Logging level |
Medium |
Medium |
n/a |
Table 1: Hardware specifications for server computers
Software
The following table explains the software that was installed and running on the servers that were used in this testing.
Front-end Web server |
Application server |
Database server |
|
Operating System |
Windows Server® 2008 R2 x64 |
Windows Server 2008 R2 x64 |
Windows Server 2008 x64 |
Software version |
Microsoft SharePoint 4763.1000 (RTM), Office Web Applications 4763.1000 (RTM) |
Microsoft SharePoint 4763.1000 (RTM), WAC 4763.1000 (RTM) |
SQL Server 2008 R2 CTP3
|
Load balancer type |
F5 – Hardware load balancer |
n/a |
n/a |
ULS Logging level |
Medium |
Medium |
n/a |
Antivirus Settings |
Disabled |
Disabled |
Disabled |
Table 2: Software specifications for server computers
Topology and configuration
The following topology diagram explains the hardware setup that was used for the tests.

Diagram 1: Farm Configuration
Refer to Diagram 1 for the services that are provisioned in the test environment.
Dataset and disk geometry
The test farm was populated with a total of 166.5 GB of MySite content, evenly distributed across 10 content databases, 27.7 GB of Profile database content, 3.7 GB of Social database content (GUIDs for Social tags, notes and ratings) and 0.14 GB of Metadata Management database content (text for social tags and corresponding GUIDs).
The following table explains the dataset in detail:
|
Number of user profiles |
~150K |
|
Average number of memberships / user |
74 |
|
Average number of direct reports / user |
6 |
|
Average number of colleagues / user |
28 |
|
Number of total profile properties |
101 |
|
Number of multivalue properties |
21 |
|
Number of audiences |
130 |
|
Number of MySites |
~10K |
|
Number of blog sites |
~600 |
|
Total number of events in activity feed |
798K* |
|
Number of social tags/ratings |
5.04M** |
Table 3: Dataset detail
*
Social tagging study from del.icio.us suggests that an active user creates 4.2 tags/month. (Tags here mean any activity of assigning metadata to URLs, and hence includes keyword tags, ratings and notes.) This means an active user creates 4.2/30 = 0.14 tags/day. Assuming 1/3rd users of the social portal are actively tagging, we have 150K/3*0.14 tagging events per day. Activity feed tables maintain activity for 14 days, hence total number of tagging activity in the activity feed table comes to 150K/3*0.14*14. In addition to tagging events, if we assume that active user generates 1 more event per day such as a profile property update or status update, we have 150K/3*1*14 events added to activity feed tables. Thus, total number of events in activity feed tables comes to 150K/3*1.14*14 = 798K Among that, 98K of events is tagging activities which may trigger security trimming; rest of the events will be randomly distributed among status update and profile property changes.
**
Assume 1/3 of population are active users, each create 4.2 tags / month, where a tag can mean a keyword tag, a note or a rating. Assuming the farm is in use for 2 years, total tags will be 150K/3 * 4.2 * 12 * 2 = 5.04M.
The table below explains the disk geometry in details:
|
Database |
ContentDB 1, 2, 3, 4 |
ContentDB 5, 6 |
ContentDB 7, 8 |
ContentDB 9, 10 |
Profile |
Social |
Metadata |
|
Database Size |
61.4 GB |
39 GB |
32.3 GB |
33.7 GB |
27.7 GB |
3.7G B |
0.14 |
|
RAID configuration |
0 |
0 |
0 |
0 |
0 |
0 |
0 |
|
Number of spindles for MDF |
1 |
1 |
1 |
1 |
6 |
1 |
1 |
|
Number of spindles for LDF |
one physical spindle shared by all databases |
||||||
Table 4: Disk geometry detail
Transactional mix
Important notes
- The tests only model prime time usage on a typical social computing portal. We did not consider the cyclical changes in user generated traffic that is seen with day-night cycles. Timer jobs, which require significant resources, such as Profile Synchronization and People Search Crawl, were tested independently with the same test workload to identify their citizenship effect.
- This test focuses more on social operations, such as newsfeeds, social tagging, and reading people profiles. It does have a small amount of typical collaboration traffic, but that is not the focus. We expect these results to help in designing a separate portal dedicated to My Sites and social features.
- Test mix does not include traffic from Search Content Crawl. However this was factored into our tests by modifying the Green Zone definition to be 40 percent SQL Server CPU usage as opposed to the standard 50 percent to allow 10percent for the search crawl. Similarly, we used 80 percent SQL Server CPU as the criteria for max RPS.
- In addition to the test mix listed in the following table, we also added eight RPS per front-end Web server for Outlook Social Connector traffic. We had security trimming turned ON, and we saw Secure Token Service being stressed as we approached about 8 RPS of Outlook Social Connector’s traffic on single front-end Web server to get activities of colleagues. This is a function of the dataset, test workload, and hardware we used in lab for testing, and you might see entirely different behavior. To avoid further stress on Secure Token Service, we decided to add Outlook Social Connector traffic as a function of the number of front-end Web servers in each iteration. Thus for 1X1X1, we have eight RPS of Outlook Social Connector traffic, while for 2X1X1 we have 16 RPS of Outlook Social Connector traffic, and so on.
Overall transaction mix is presented in the following table:
|
Description |
Read/write |
% of mix |
|
Add a colleague |
Write |
2.11% |
|
Create a rating on a URL, write a note or tag a URL |
Write |
3.22% |
|
List operations document |
Read/Write |
2.36% |
|
Get published links to model client calls to PublishedLinksService.asmx |
Read |
6.92% |
|
Get RSS feeds from lists |
Read |
3.72% |
|
View all items in document libraries and lists on My Site |
Read |
1.07% |
|
View a blog post |
Read |
0.04% |
|
View various My Site pages (my content, colleagues, newsfeed, my profile, someone else’s profile, organization browser, memberships, tags, and notes) |
Read |
3.87% |
|
Sync for Shared OneNote files |
Read |
10.0% |
|
Edit my profile page or status message, update picture |
Write |
2.31% |
|
Office Web Applications: Open and scroll files (PowerPoint®, Word, Excel®) |
Read |
0.13% |
|
List sync with Outlook® |
Read |
48.16% |
|
Upload a document |
Write |
0.09% |
|
Loading pages, document libraries, folders from Content DB |
Read |
15.93% |
|
Co-authoring of documents |
Read/Write |
0.17% |
Table 5: Transactional Mix
Additional Outlook Social Connector scenario test mix generating 8 RPS per front-end Web server:
|
Auto-sync my colleagues |
Read |
4% |
|
Auto-sync my colleagues’ news feeds |
Read |
96% |
Table 6: Outlook Social Connector scenario text mix
Results and analysis
Comparison of all iterations
As mentioned earlier, we started off with a minimal farm configuration of one front-end Web server, one application server and one SQL Server-based computer. Through multiple iterations, we finally ended at eight front-end Web servers, one application server, two SQL Server-based farm configurations. For each of these iterations, we performed step load tests to identify Green Zone and Max Zone. Details of step load tests within each iteration are provided in the Appendix. In the following table, you will find comparison of these Green Zone and Max Zone performance characteristics across different iterations.
The following table and charts provide a summary for comparison and analysis.
Green Zone results:
First let’s take a look at Green Zone performance characteristics across topologies. The following table provides a summary of results:
|
Topology |
1x1x1 |
2x1x1 |
3x1x1 |
5x1x1 |
8x1x1 |
8x1x2 |
|
Green Zone RPS |
137.25 |
278.08 |
440.72 |
683.07 |
793.67 |
873.4 |
|
Green Zone 75th Percentile Latency |
0.12 |
0.16 |
0.14 |
0.16 |
0.31 |
0.32 |
|
Green Zone front-end Web server CPU |
47.84 |
46.88 |
48.68 |
46.13 |
31.79 |
36.90 |
|
Green Zone application server CPU |
9.45 |
18.88 |
26.91 |
35.58 |
48.73 |
47.20 |
|
Green Zone SQL Server CPU |
5.45 |
10.61 |
16.46 |
24.73 |
30.03 |
32.40 (17.9 for Content DB and 14.5 for Services DB) |
Table 7:Green Zone performance
The following chart presents variation in CPU utilizations plotted on RPS, and offered by different topologies for Green Zone results.
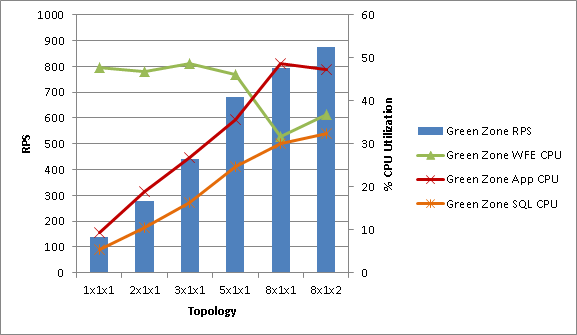
From the chart above:
- RPS increased throughout as we added more computers to topologies.
- It is clear that front-end Web server CPU was the driving factor leading the topology to the boundary of Green Zone until 5X1X1, and at 8X1X1 application server CPU reached the boundary for Green Zone before the front-end Web servers could reach Green Zone boundaries.
- Throughout, SQL Server CPU was in a very healthy territory.
Max Zone results:
The following table provides a summary of results across topologies for Max Zone.
|
1x1x1 |
2x1x1 |
3x1x1 |
5x1x1 |
8x1x1 |
8x1x2 |
|
|
Max Zone RPS |
203.28 |
450.75 |
615.00 |
971.13 |
1655 |
1877 |
|
Max Zone Latency |
0.22 |
0.23 |
0.22 |
0.22 |
0.31 |
0.32 |
|
Max Zone front-end Web server CPU |
75.13 |
78.17 |
70.00 |
67.02 |
67 |
71.6 |
|
Max Zone application server CPU |
12.97 |
27.07 |
28.40 |
48.28 |
67.1 |
73.4 |
|
Max Zone SQL Server CPU |
7.64 |
16.06 |
21.00 |
38.38 |
79.5 |
74.9 (45.9 for Content DB and 29 for Services DB) |
Table 8: Results across topologies for Max Zone
The following chart presents variation in CPU utilizations plotted on RPS, and offered by different topologies for Max Zone results.
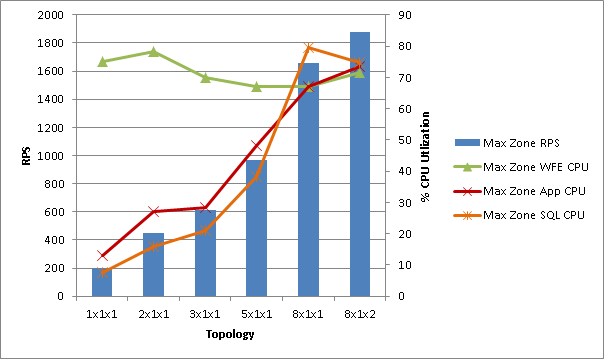
From the preceding chart:
- RPS increased throughout as we added more computers to topologies.
- It is clear that front-end Web server CPU was the bottleneck until 5X1X1, and at 8X1X1 SQL CPU became the bottleneck.
- Initially, application server CPU utilization was higher than SQL Server CPU utilization, but it is apparent that the growth rate of SQL Server CPU utilization is more than the growth rate of application server CPU utilization. At higher throughput, SQL Server CPU utilization overtook application server CPU utilization and became the bottleneck.
Green Zone vs. Max Zone:
The following charts compare throughput and latencies for Green Zone and Max Zone across different topologies.
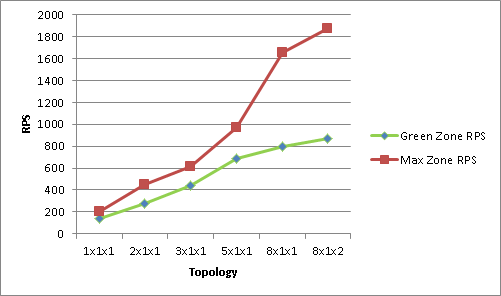
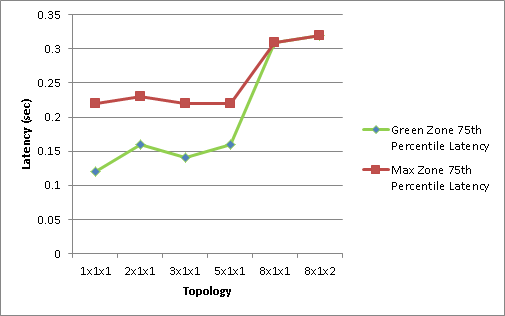
From the charts above:
- Latencies don’t vary much with throughput or topologies. In our testing we saw all latencies under 0.5 seconds, which is very acceptable.
- Throughput increase is almost linear.
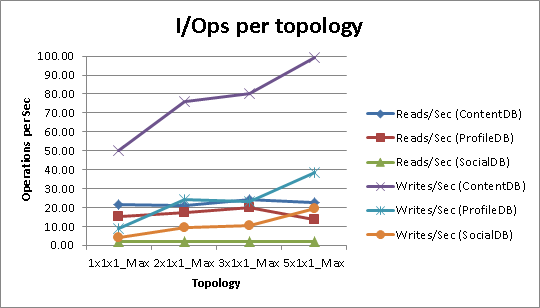
A note on I/Ops:
The following table and chart presents I/Ops observed on each database in different topologies. We did not run into disk I/O as a bottleneck, and looking at the trend, we did not record the data for later topologies.
|
|
1x1x1 Max Zone |
2x1x1 Max Zone |
3x1x1 Max Zone |
5x1x1 Max Zone |
|
Reads/Sec (ContentDB) |
21.33 |
20.80 |
24.24 |
22.42 |
|
Reads/Sec (ProfileDB) |
14.97 |
17.20 |
19.82 |
13.50 |
|
Reads/Sec (SocialDB) |
1.81 |
1.83 |
2.10 |
2.01 |
|
Writes/Sec (ContentDB) |
50.12 |
76.24 |
80.02 |
99.16 |
|
Writes/Sec (ProfileDB) |
9.01 |
24.31 |
23.35 |
38.29 |
|
Writes/Sec (SocialDB) |
4.12 |
9.47 |
10.63 |
19.45 |
Table 9: Observed I/Ops
Effect of people search crawl
We wanted to measure the effect of people search crawl on throughput offered by a configuration and by end user latencies. For this testing, we used results given by 8X1X1 configuration as baseline and started the incremental people search crawl. The incremental crawl indexed 49,375 items in 53 minutes.
Comparison of performance characteristics exhibited by the 8X1X1 configuration with and without people search incremental crawl are presented in the following table:
|
Baseline 8X1X1 Green Zone results |
8X1X1 with People Search crawl Green Zone results |
|
|
Throughput [RPS] |
1024.00 |
1026.00 |
|
Front-end Web server CPU [%] |
39.84 |
41.6 |
|
Application server CPU [%] |
41.40 |
43.1 |
|
Content/Service SQL Server CPU [%] |
36.63 |
39.5 |
|
Indexer CPU [%] |
0.52 |
34.6 |
|
Search SQL CPU [%] |
3.62 |
14.8 |
Table 10: Comparison of performance characteristics
From the table above:
- RPS nearly remained the same. Because there was no resource bottleneck in the 8X1X1 Green Zone, there is no reason for RPS to be affected.
- The front-end Web server and Content/Service SQL Server CPU utilization became only slightly higher.
-
Search Indexer and SQL Server CPU increased from 0.5% to 34.6%, and 3.6% to 14.8%.
Analysis
Application Server Scale
You might have noticed that in none of the configurations did we find application server as a bottleneck. Further, if you see application server CPU utilization for different VSTS loads in any single configuration, you will notice that it grows and then flattens out. An ideal example of this is seen in the 8X1X1 configuration (detailed results are in Appendix):
|
VSTS Load |
416 |
616 |
816 |
1016 |
1216 |
1416 |
1616 |
|
Application server CPU |
37.6 |
49.4 |
57.9 |
61.9 |
67.1 |
65.3 |
63.10 |
This is expected. In the case of a social portal, most of the operations require dealing with a SharePoint service called User Profile Service. Most of the operations require fetching a user’s profile from Profile DB that is provisioned when User Profile Service is created.
To avoid frequent SQL Server round trips, application server for User Profile Service maintains a cache of User Profiles. Initially, as the test environment is warming up, this cache is empty, and the application server is responding to incoming requests from the front-end Web server by constantly fetching User Profiles from SQL Server. These profiles are then cached, and subsequently, all requests from the front-end Web server can be responded to by the application server without causing a SQL Server round trip, by just looking up in the cache.
Because the number of user profiles used in testing was limited, we saw the application server warm up to cache all those user profiles, hence it showed an increasing utilization. When all the profiles were cached, it was a steady operation of cache lookups, and hence we see the application server CPU utilization stabling down.
Outlook Social Connector traffic and security trimming
Outlook Social Connector is an add-in that ships with Office 2010, which shows activities by your SharePoint Colleagues in Outlook. This add-in is also available for free download for Office 2007 and Office 2003.
Outlook Social Connector pings SharePoint server once every hour to fetch activities by colleagues of the user who is using it. It caches those activities for the hour. Next hour, it only asks for the delta of activities since the last time it called SharePoint. Thus, it follows a very predictable traffic pattern. For a 100,000-people deployment of Outlook Social Connector and SharePoint, assuming everyone is using it all day long, it generates 100,000 requests per hour, which translates to 27.77 requests per second.
Showing activities by other people leads to a possibility of information disclosure; if the URL that is tagged by a colleague is something confidential that a user does not have access to, then the user can find out about existence of that confidential piece of content by seeing it in Outlook Social Connector. To prevent this information disclosure, SharePoint filters all activities and shows only those URLs in activities that a user has access to. This filtering is what we call security trimming. It is ON by default, but it can be turned off.
Not every activity requires security trimming. Out of 16 activity type SharePoint supports, only 4 (tagging, note board comments, rating and DL membership changes) require security trimming. Also, because Outlook Social Connector asks only for a delta of activities that have happened since last time it synced, the number of activities per user that would require security trimming would be reasonably low.
Every request from Outlook Social Connector requiring security trimming results in an authenticated WCF call to Search Service’s application server. To get the authentication token for making this call, a WCF call is initially made to Secure Token Service.
We found out that if the Outlook Social Connector RPS goes beyond eight RPS per front-end Web server, Secure Token Service was under stress. This might or might not happen to each customer, because it is affected by the number of total users and total social tagging being made to a user’s colleagues. In the dataset we created, and the users we used, we probably had enough activities requiring security trimming that we saw this happen. Hence, we increased Outlook Social Connector traffic as a function of the number of front-end Web servers available. For the 1X1X1 configuration, we generated 8 RPS of Outlook Social Connector traffic, while for a 2X1X1 configuration we generated 16 RPS of Outlook Social Connector traffic, and so on.
This means, for the dataset, test mix, and hardware we had for testing, we could support about 8*60*60, that is, 28,800 requests per hour. With the way Outlook Social Connector works, this means that we could have supported 28,800 employees using Outlook Social Connector on a single front-end Web server with security trimming ON. Similarly, we could support 28,800*3, which is 86,400 employees using Outlook Social Connector on three front-end Web servers with security trimming ON.
This should help you estimate the hardware that is required to support Outlook Social Connector traffic, but keep in mind that the results we saw are specific to the dataset, test mix, and hardware we used for testing. Also, keep in mind that you have the option of turning off security trimming using PowerShell, or changing the frequency of Outlook Social Connector sync with SharePoint. Both of these options will have significant effect on hardware requirements.
Recommendations
Overall, in our testing, we found that:
- The environment scaled up to eight front-end Web servers for one application server and one database server; increase in throughput was almost linear throughout. After eight front-end Web servers, there are no additional gains to be made in throughput by adding more front-end Web servers because the bottleneck at this point was the database server CPU utilization.
- Further scale can be achieved by separating content database and services database on two separate database servers.
- We maxed out the 8x1x2 topology. At that point both the front end Web server and the application server CPU utilization was bottleneck. That leads us to believe that for the given hardware, dataset, and test workload, max RPS possible is represented by Max Zone RPS for 8x1x2, which is about 1877.
- Looking at the trends, it seems possible to extract the same throughput with a healthy farm, if the bottlenecks on front-end Web server and application server are addressed. The front end Web server bottleneck can be addressed by adding more front-end Web servers, and the application server bottleneck can be addressed by using two computers to play the role of application server. We did not try it out in the lab though.
- Latency is not affected by throughput or hardware variations.
- If you have security trimming turned ON, one front-end Web server can support about 8-10 RPS of Outlook Social Connector traffic. This means, one front-end Web server can support about 28,000 to 36,000 employees using Outlook Social Connector all day. Thus, if you are rolling out Outlook Social Connector to 100,000 employees, you can support the traffic generated by three front-end Web servers. These values can vary depending on social tagging usage at your company. If you imagine your company to have less social tagging activity than what we used in the dataset for this testing effort, you can get better throughput per front-end Web server.
- Incremental people search crawl doesn’t have much effect on the farm’s throughput as long as farm is maintained in a healthy state.
Appendix
Results from iterations
1 X 1 X 1 topology
Summary of results
- In addition to the test mix presented above, this farm had eight RPS traffic of Outlook Social Connector asking for feed events by a user.
- On a one front-end Web servers, one application server and one SQL Server-based farm, clearly the front-end Web server was the bottleneck. As presented in the data in the following table, front-end Web server CPU reached about 90 percent utilization when the farm was subjected to RPS of 238, using the transactional mix that is described earlier in this document.
- This configuration delivered Green Zone RPS of 137.25, with 75th percentile latency being 0.12 sec, and front-end Web servers CPU hovering around 47.8 percent utilization. This indicates that this farm can healthily deliver an RPS of about 137.25. Max Zone RPS delivered by this farm was 203.2 with latencies of 0.22 sec and front-end Web server CPU hovering around 85 percent.
- Because the front-end Web server was bottlenecked, for the next iteration, we added another front-end Web server to the farm.
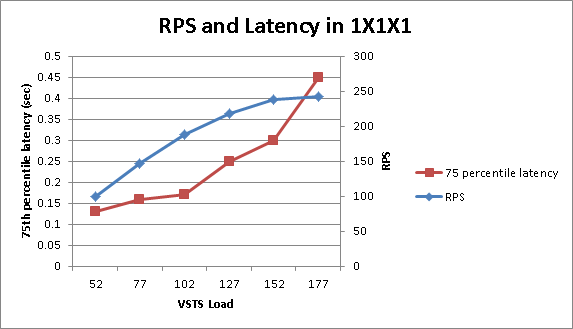
Performance counters and graphs
Various performance counters captured during testing a 1 X 1 X 1 farm, at different steps in VSTS load, are presented below.
|
VSTS Load |
52 |
77 |
102 |
127 |
152 |
177 |
|
RPS |
99.8 |
147 |
188 |
218 |
238 |
243 |
|
Front-end Web server CPU |
33.9 |
50 |
71.8 |
81.1 |
90.8 |
89 |
|
Application Server CPU |
7.92 |
11.7 |
13.5 |
14.1 |
13.9 |
13.3 |
|
SQL Server CPU |
4.7 |
6.48 |
7.99 |
8.21 |
8.41 |
8.88 |
|
75th Percentile [sec] |
0.13 |
0.16 |
0.17 |
0.25 |
0.3 |
0.45 |
|
95th Percentile [sec] |
0.29 |
0.47 |
0.41 |
0.55 |
0.55 |
0.77 |
Table 1: Performance counters in a 1X1X1 farm configuration

2 X 1 X 1 farm configuration
Summary of results
- In addition to the test mix presented above, this farm had 16 RPS traffic of Outlook Social Connector asking for feed events by a user.
- On a two front-end Web server, one application server, and one SQL Server-based farm, the front-end Web server was the bottleneck. As presented in the data below, the front-end Web server CPU reached about 89 percent utilization when the farm was subjected to RPS of 520, using the transactional mix described earlier in this document.
- This configuration delivered Green Zone RPS of 278, with 75th percentile latency being 0.16 sec, and the front-end Web server CPU hovering around 47 percent utilization. This indicates that this farm can healthily deliver an RPS of about 278 with the test mix and hardware used for tests. Max Zone RPS delivered by this farm was 450 with latencies of 0.23 sec and the front-end Web server CPU hovering around 78 percent.
- Because the front-end Web server CPU was the bottleneck in this iteration, we relived the bottleneck by adding another front-end Web server for the next iteration.
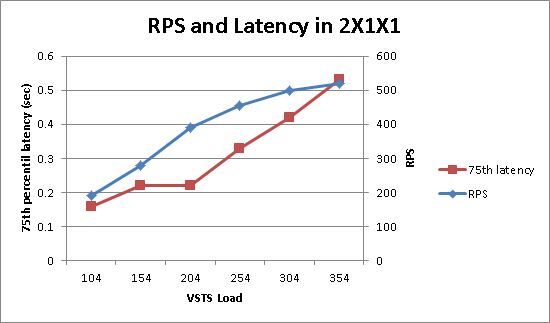
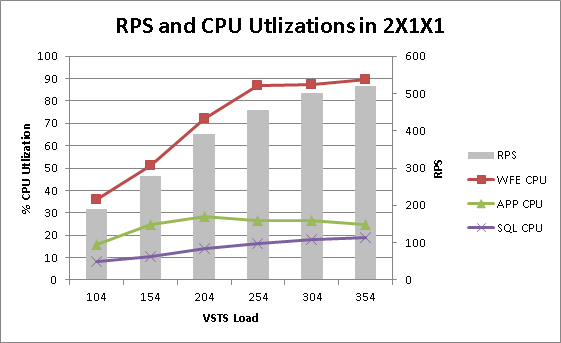
Performance counters and graphs
Various performance counters captured during testing 2 X 1 X 1 farm, at different steps in VSTS load, are presented in the following table and chart.
|
VSTS Load |
104 |
154 |
204 |
254 |
304 |
354 |
|
RPS |
190 |
278 |
390 |
455 |
500 |
520 |
|
Front-end Web server CPU |
36 |
50.9 |
71.9 |
86.9 |
87.1 |
89.5 |
|
Application server CPU |
16 |
24.9 |
28.3 |
26.5 |
26.5 |
24.9 |
|
SQL Server CPU |
8.06 |
10.6 |
14.2 |
16.4 |
17.9 |
18.9 |
|
75th Percentile [sec] |
0.16 |
0.22 |
0.22 |
0.33 |
0.42 |
0.53 |
|
95th Percentile [sec] |
0.42 |
0.64 |
0.51 |
0.69 |
0.73 |
0.89 |
Table 2: Performance Counters during 2 X 1 X 1 configuration
3 X 1 X 1 farm configuration
Summary of results
- In addition to the test mix presented above, this farm had 24 RPS traffic of Outlook Social Connector asking for feed events by a user.
- On a three front-end Web server, one application server, and one SQL Server-based farm, the front-end Web server was the bottleneck. As presented in the data below, the front-end Web server CPU reached about 76 percent utilization when the farm was subjected to RPS of 629, using the transactional mix described earlier in this document.
- This configuration delivered Green Zone RPS of 440, with 75th percentile latency being 0.14 sec, and the front-end Web server CPU hovering around 48 percent utilization. This indicates that this farm can healthily deliver an RPS of about 440 with the test mix and hardware used for tests. Max Zone RPS delivered by this farm was 615 with latencies of 0.22 sec and the front-end Web server CPU hovering around 70 percent.
-
Because the front-end Web server CPU was the bottleneck in this iteration, we decided to add more front-end Web servers. Considering the delta between iterations seen previously by addition of a front-end Web server, we decided to add two front-end Web servers. We hoped to find application server or SQL Server as a bottleneck by doing so.
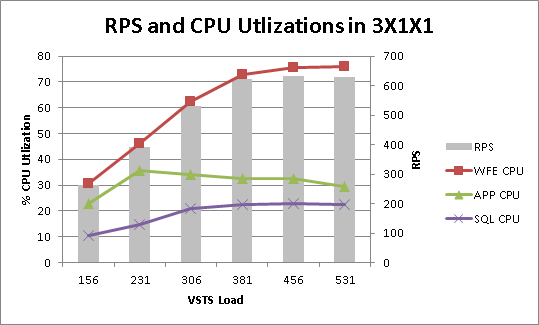
Performance counters and graphs
Various performance counters captured during testing the 3 X 1 X 1 farm, at different steps in VSTS load, are presented in the following table and charts.
|
VSTS Load |
156 |
231 |
306 |
381 |
456 |
531 |
|
RPS |
264 |
393 |
532 |
624 |
634 |
629 |
|
Front-end Web server CPU |
30.5 |
46.3 |
62.55 |
72.95 |
75.4 |
76 |
|
Application server CPU |
22.7 |
35.6 |
34.2 |
32.5 |
32.5 |
29.4 |
|
SQL Server CPU |
10.4 |
14.8 |
20.8 |
22.5 |
22.8 |
22.4 |
|
75th Percentile [sec] |
0.17 |
0.26 |
0.27 |
0.28 |
0.31 |
0.40 |
|
95th Percentile [sec] |
0.63 |
1.08 |
0.76 |
0.68 |
0.88 |
0.98 |
Table 3: Performance counters during 3X1X1 configuration

5 X 1 X 1 farm configuration
Summary of results
- In addition to the test mix presented above, this farm had 40 RPS traffic of Outlook Social Connector asking for feed events by a user.
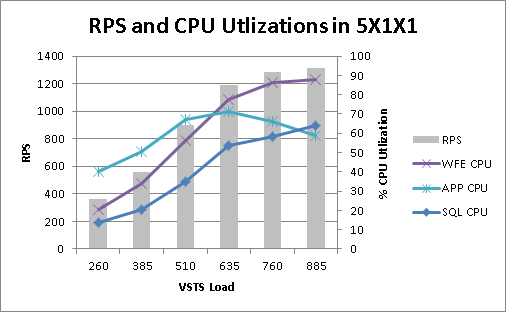
- On a five front-end Web server, one application server, and one SQL Server-based farm, we saw significant increase in SQL Server CPU and application server CPU utilization, but still, the front-end Web server CPU was the bottleneck. As presented in the data below, the front-end Web server CPU reached about 88 percent utilization when the farm was subjected to RPS of 1315, using the transactional mix described earlier in this document.
- This configuration delivered Green Zone RPS of 683, with 75th percentile latency being 0.16 sec, and the front-end Web server CPU hovering around 46 percent utilization. This indicates that this farm can healthily deliver an RPS of about 683 with the test mix and hardware used for tests. Max Zone RPS delivered by this farm was 971 with latencies of 0.22 sec and the front-end Web server CPU hovering around 68percent.
- Looking at the trend, we decided to add three front-end Web servers and test for 8X1X1 configuration. We hoped to find application server or SQL Server as a bottleneck with that configuration
Performance counters and graphs
Various performance counters captured during testing 5 X 1 X 1 farm, at different steps in user load, are presented below. Because we saw no significant effect of VSTS load or configuration changes on latency, we stopped recording it.
|
VSTS Load |
260 |
385 |
510 |
635 |
760 |
885 |
|
RPS |
359 |
560 |
901 |
1188 |
1281 |
1315 |
|
front-end Web server CPU |
20.5 |
34 |
56.2 |
77.5 |
86.1 |
88 |
|
Application server CPU |
40.2 |
50.6 |
66.9 |
71.3 |
66.3 |
58.7 |
|
SQL Server CPU |
13.9 |
20.3 |
34.9 |
53.6 |
58.4 |
64 |
Table 4: Performance counters during 5X1X1 configuration
8 X 1 X 1 farm configuration
Summary of results
- In addition to the test mix presented above, this farm had 64 RPS traffic of Outlook Social Connector asking for feed events by a user.
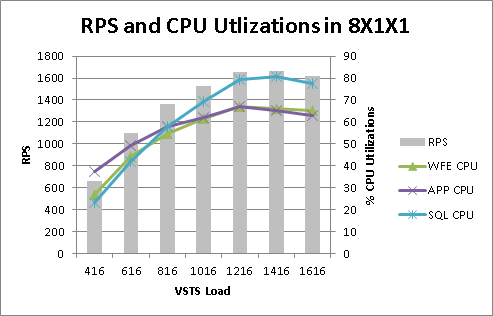
- On eight front-end Web servers, one application server, and one SQL Server-based farm, finally, SQL Server CPU was the bottleneck. As presented in the data below, SQL Server CPU reached about 80 percent utilization when the farm was subjected to RPS of 1664, using the transactional mix described earlier in this document.
- This configuration delivered Green Zone RPS of 793, with 75th percentile latency being 0.31 sec, and SQL Server CPU hovering around 30 percent utilization, while application server CPU was about 48 percent. This indicates that this farm can healthily deliver an RPS of about 793 with the test mix and hardware used for tests. Max Zone RPS delivered by this farm was 1655 with latencies of 0.31 sec and SQL Server CPU hovering around 80 percent.
- Because SQL Server CPU was the bottleneck in this iteration, we relived the bottleneck by separating out the content database and services database on two different instances of SQL Server for the next iteration.
Performance counters and graphs
Various performance counters captured during testing the 8 X 1 X 1 farm, at different steps in VSTS load, are presented in the following table and chart.
|
VSTS Load |
416 |
616 |
816 |
1016 |
1216 |
1416 |
1616 |
|
RPS |
664 |
1101 |
1359 |
1530 |
1655 |
1664 |
1617.00 |
|
Front-end Web server CPU |
26.7 |
44.4 |
54.7 |
61.5 |
67 |
65.9 |
65.10 |
|
Application server CPU |
37.6 |
49.4 |
57.9 |
61.9 |
67.1 |
65.3 |
63.10 |
|
SQL Server CPU |
23.2 |
42 |
57.9 |
69.5 |
79.5 |
80.8 |
77.30 |
Table 5: Performance counters during 8X1X1 configuration
8 X 1 X 2 farm configuration
Summary of results
- In addition to the test mix presented above, this farm had 64 RPS traffic of Outlook Social Connector asking for feed events by a user.
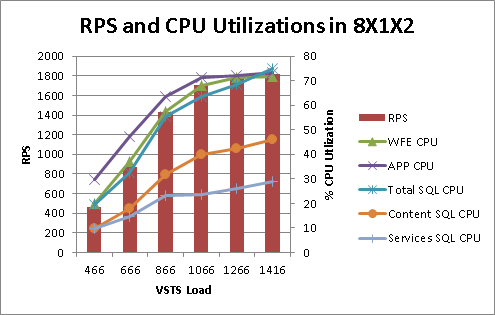
- On an eight front-end Web server, one application server, and two SQL Server-based farms, we could take the configuration to its extreme. The front-end Web server and application server, both were bottlenecked, while combined SQL Server utilization was also in the higher 70s. The farm exhibited RPS of 1817 at max.
- This was the last iteration we tried. But clearly, if you need more scale, the next step would be to use two computers to perform application server duties. That would allow you to have many more front-end Web servers, and hence load on each front-end Web server will be less.
Performance counters and graphs
Various performance counters captured during testing 8 X 1 X 2 farm, at different steps in VSTS load, are presented in the following table and chart.
|
VSTS Load |
466 |
666 |
866 |
1066 |
1266 |
1416 |
|
RPS |
466.00 |
873.40 |
1431.00 |
1703.00 |
1766.00 |
1817.00 |
|
Front-end Web server CPU |
19.90 |
36.90 |
57.60 |
68.00 |
71.40 |
71.60 |
|
Application server CPU |
29.80 |
47.20 |
63.50 |
71.40 |
71.90 |
73.40 |
|
Total SQL Server CPU |
19.61 |
32.40 |
55.20 |
63.60 |
68.50 |
74.90 |
|
Content SQL Server CPU |
9.93 |
17.90 |
31.90 |
40.10 |
42.30 |
45.90 |
|
Services SQL Server CPU |
9.68 |
14.50 |
23.30 |
23.50 |
26.20 |
29.00 |
Table 6: Performance counters during 8X1X2 configuration
Discover more from Escape Business Solutions
Subscribe to get the latest posts sent to your email.